Deformations of walls and floors
Deformations, subsidence, or wear in floors, kiln walls, and tanks can be accurately mapped using 3D scanning. Software translates these into color patterns that clearly visualize deviations. By comparing scans taken at different times, temporal deformations can also be assessed via point cloud comparison. If desired, we can also assess the measured deviations against the tolerances defined in DIN 18202, the standard for surface flatness in construction.
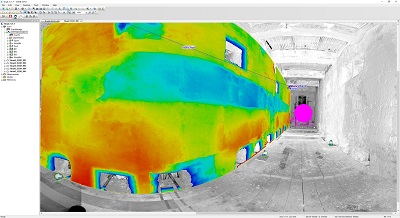

In the left example, a kiln wall shows visible deformation. By repeatedly scanning the wall, we can visualize the differences between two scan moments.
In the right example, floor level deviations are mapped — green represents level baseline, red is elevated, and blue indicates lower areas.
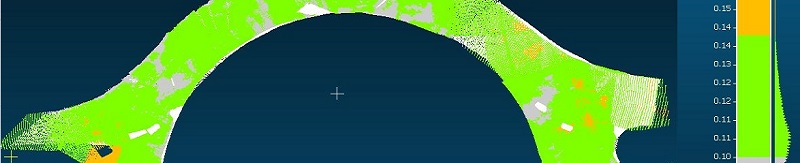
The above is a cloud to cloud comparison with two different scanning moments of a roundabout, the first scanning moment is from the foundation layer and the second from the top layer, in this way it is easy to make clear what the mutual differences and layer thicknesses are.
 Read more...